

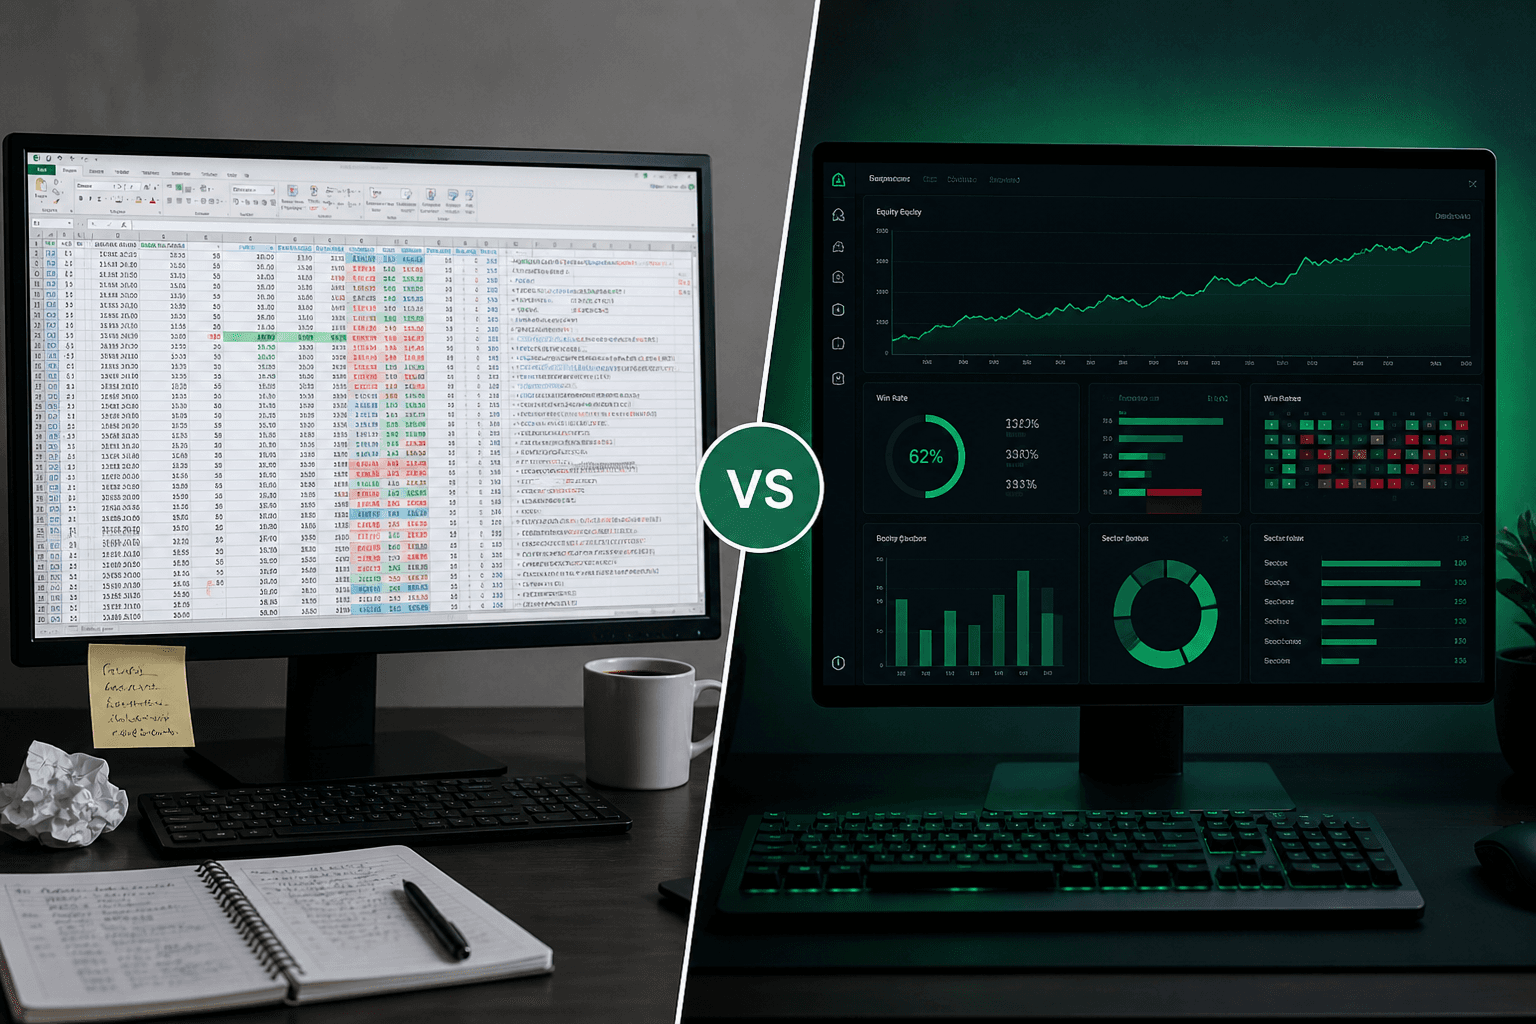
Photo: SwingTradingLog
Why SwingTradingLog Beats Most Trading Journals (Free, Analytics, Risk Tools)
Compare SwingTradingLog to paid journals and spreadsheets: free forever, built-in risk sizing, deep swing analytics, overnight exposure, live open-position P&L, and in-app feedback.
Most traders do not fail because they lack a journal. They fail because the journal they chose creates friction: another subscription, another import step, another dashboard that looks impressive on demo day and empty on yours. SwingTradingLog was built for swing traders who want structure without paying enterprise prices, or without rebuilding spreadsheets every month.
The three journal traps
- Paid platforms that charge monthly before you have enough closed trades to learn anything
- Broker dashboards that show P&L but not process, tags, or review habits
- Spreadsheets that work until formulas break, columns multiply, and Sunday review takes an hour
SwingTradingLog takes a different path: free access to the full product, analytics aimed at multi-day holds, and risk tools wired into how you log a trade, not bolted on as an upsell.
SwingTradingLog vs typical journals (at a glance)
| Capability | SwingTradingLog | Typical paid journal | Spreadsheet |
|---|---|---|---|
| Price | Free forever | $20–50+/month | Free but your time |
| Full dashboard & analytics | Included | Often tiered | Build yourself |
| Smart position / risk sizing | Built into trade entry | Rare or add-on | Manual formulas |
| Overnight & weekend exposure | Dashboard view | Uncommon | Manual sum |
| Sector & market-cap attribution | Analytics hub | Premium only | Pivot tables |
| Live daily P&L on open trades | Chart + journal | Broker-only | Manual quotes |
| Goals & discipline tracking | Included | Sometimes | No |
| Shareable trade cards | Included | Rare | No |
| In-app product feedback | Included | Email ticket | N/A |
| CSV export & backup | Included | Usually yes | Native |

1. Totally free, not a stripped-down trial
SwingTradingLog does not hide the analytics hub behind a paywall or cap your trade count after fourteen days. Dashboard, journal, goals, settings, export, and feedback are the product, not a teaser. That matters for swing traders who need months of closed trades before stats mean anything. You should not pay subscription rent while you are still building sample size.
Included at no cost today
- Dashboard with period filters (today through custom ranges)
- KPI ribbon: net P&L, profit factor, win rate, avg R:R, max drawdown
- Full journal with strategies, tags, notes, and chart screenshots
- Analytics hub for attribution, timing, and outcome sizing
- Goals and discipline tracking
- CSV export and JSON workspace backup
2. Risk calculator & smart position sizing: before you click buy
Swing trades fail in sizing more often than in stock selection. SwingTradingLog embeds a Risk Calculator directly in the add-trade flow: set capital at risk, stop, target, and R:R, and the journal computes quantity, rupee risk, and reward. Apply the numbers to the trade in one tap instead of juggling a separate calculator app and your journal.
- Stop and target drive quantity, not gut feel share count
- Planned R preview before the trade is saved
- Repeat prior setups with sizing rules carried forward
- Public risk calculator page for quick what-if math (standalone tool expanding on the roadmap)
3. Analytics built for swing traders, not day-trading vanity metrics
Win rate alone lies when losers are bigger than winners. SwingTradingLog foregrounds profit factor, average R:R, drawdown, and period filters so weekly review stays under twenty minutes. Go deeper on the Analytics page when you need attribution, not every Sunday.
- Sector and market-cap breakdown: see which parts of the market pay you
- R-multiple spectrum: are you taking enough on winners?
- Session and hold-time grids: when do your setups actually work?
- Performance breakdown cards and edge panels for closed-trade attribution
- Portfolio overview on the dashboard: invested capital, total P&L, timeline, and Nifty 50 benchmark context
- Daily P&L chart on open positions with live quote updates for today’s session
4. Active trades treated as open risk, not forgotten rows
Multi-day holds mean gap risk, earnings windows, and capital tied up while you sleep. Most journals focus on closed-trade history. SwingTradingLog keeps Active positions visible: overnight and weekend notional on the dashboard, daily P&L on open names, and journal columns for live marks. You see exposure next to realized P&L, which is how swing risk should be read.
5. In-app feedback: you shape the roadmap
Trading journals often feel like black boxes maintained for institutions. SwingTradingLog includes a Feedback page for signed-in users: report bugs, request features, or send product notes without hunting for a support email. Swing traders use the product daily; their input should land where builders actually read it.
6. Goals, share cards, and exports: the operational layer
- Goals: set process targets (max trades, loss limits) and track them alongside P&L
- Shareable branded trade cards for closed winners and learning moments
- Customizable journal columns so the table matches your workflow
- CSV export and JSON backup so your history survives platform changes
When a paid journal might still make sense
Honest comparison: if you need automatic broker sync from dozens of accounts, institutional reporting, or prop-firm compliance exports, enterprise journals may fit better. If you trade manually across one or two accounts and care about review quality, sizing discipline, and swing-specific analytics, paying monthly often buys features you will not open. SwingTradingLog optimizes for that second profile.
Quick start: prove it in one week
Seven-day comparison test
- Day 1: Log your next swing with stop, target, and Risk Calculator sizing applied
- Day 2–5: Mark trades Active or Closed; note one sentence per entry
- Day 6: Open Analytics and check sector and market-cap tables
- Day 7: Run a twenty-minute review using dashboard KPIs and journal filters
- Optional: Send one piece of feedback on what would make review even faster
Try the journal traders actually finish
SwingTradingLog is free forever, built for multi-day holds, and designed so logging takes less time than arguing with a spreadsheet. Create an account, log one trade with the Risk Calculator, and compare your Sunday review to whatever workflow you use today. If the analytics surface a leak you had not seen, keep the journal. If not, you lost nothing but an hour.
Is SwingTradingLog really free?
Yes. Dashboard, journal, analytics, goals, settings, CSV export, and in-app feedback are included at no cost. There is no credit card required to sign up, and no paywall hiding core features behind a premium tier.
How is SwingTradingLog different from Excel or Google Sheets?
Spreadsheets are flexible but high-friction: you build every formula, chart, and filter yourself, and reviews stall when the sheet gets messy. SwingTradingLog logs trades in under two minutes, updates analytics automatically, tracks overnight exposure on open positions, and surfaces sector and market-cap performance without pivot tables.
Does SwingTradingLog replace my broker?
No. You log trades manually (or repeat setups from prior entries). The value is discipline, analytics, and risk visibility, not order execution. Many traders use SwingTradingLog alongside any broker or platform they already trade on.
What markets and currencies does SwingTradingLog support?
The journal supports equities, options, crypto, and forex with multi-currency display (INR, USD, EUR, GBP, CAD). Listing market and session logic adapts daily P&L and overnight risk for NSE, US, and other major markets.
Where is the risk calculator?
Smart position sizing is built into the trade entry flow: enter capital, stop, target, and R:R to compute quantity and rupee risk before you save the trade. A standalone public risk calculator page is on the roadmap; the in-app Risk Calculator in the journal is available today.
Can I send product feedback or report bugs?
Yes. Signed-in users can submit feature requests, bug reports, and general feedback from the in-app Feedback page. Submissions go directly to the product team so swing traders can shape what ships next.
What analytics does SwingTradingLog include?
Beyond dashboard KPIs (P&L, profit factor, win rate, avg R:R, drawdown), the Analytics hub includes sector and market-cap attribution, R-multiple spectrum, session and hold-time breakdowns, edge panels, realized P&L trends, and a daily P&L chart for open positions with live quote updates.
Who is SwingTradingLog best for?
Swing and position traders who hold for days or weeks, care about overnight risk, and want review habits without paying for bloated software. It is especially useful if you have outgrown spreadsheets but do not need a $40/month journal with features you never open.
Ready to log your swings? Start free on SwingTradingLog, or explore trading guides and the risk calculator.