

Dashboard
Performance and open risk in one view
Your KPIs, equity curve, and overnight exposure update as you log trades, with period filters across the top.
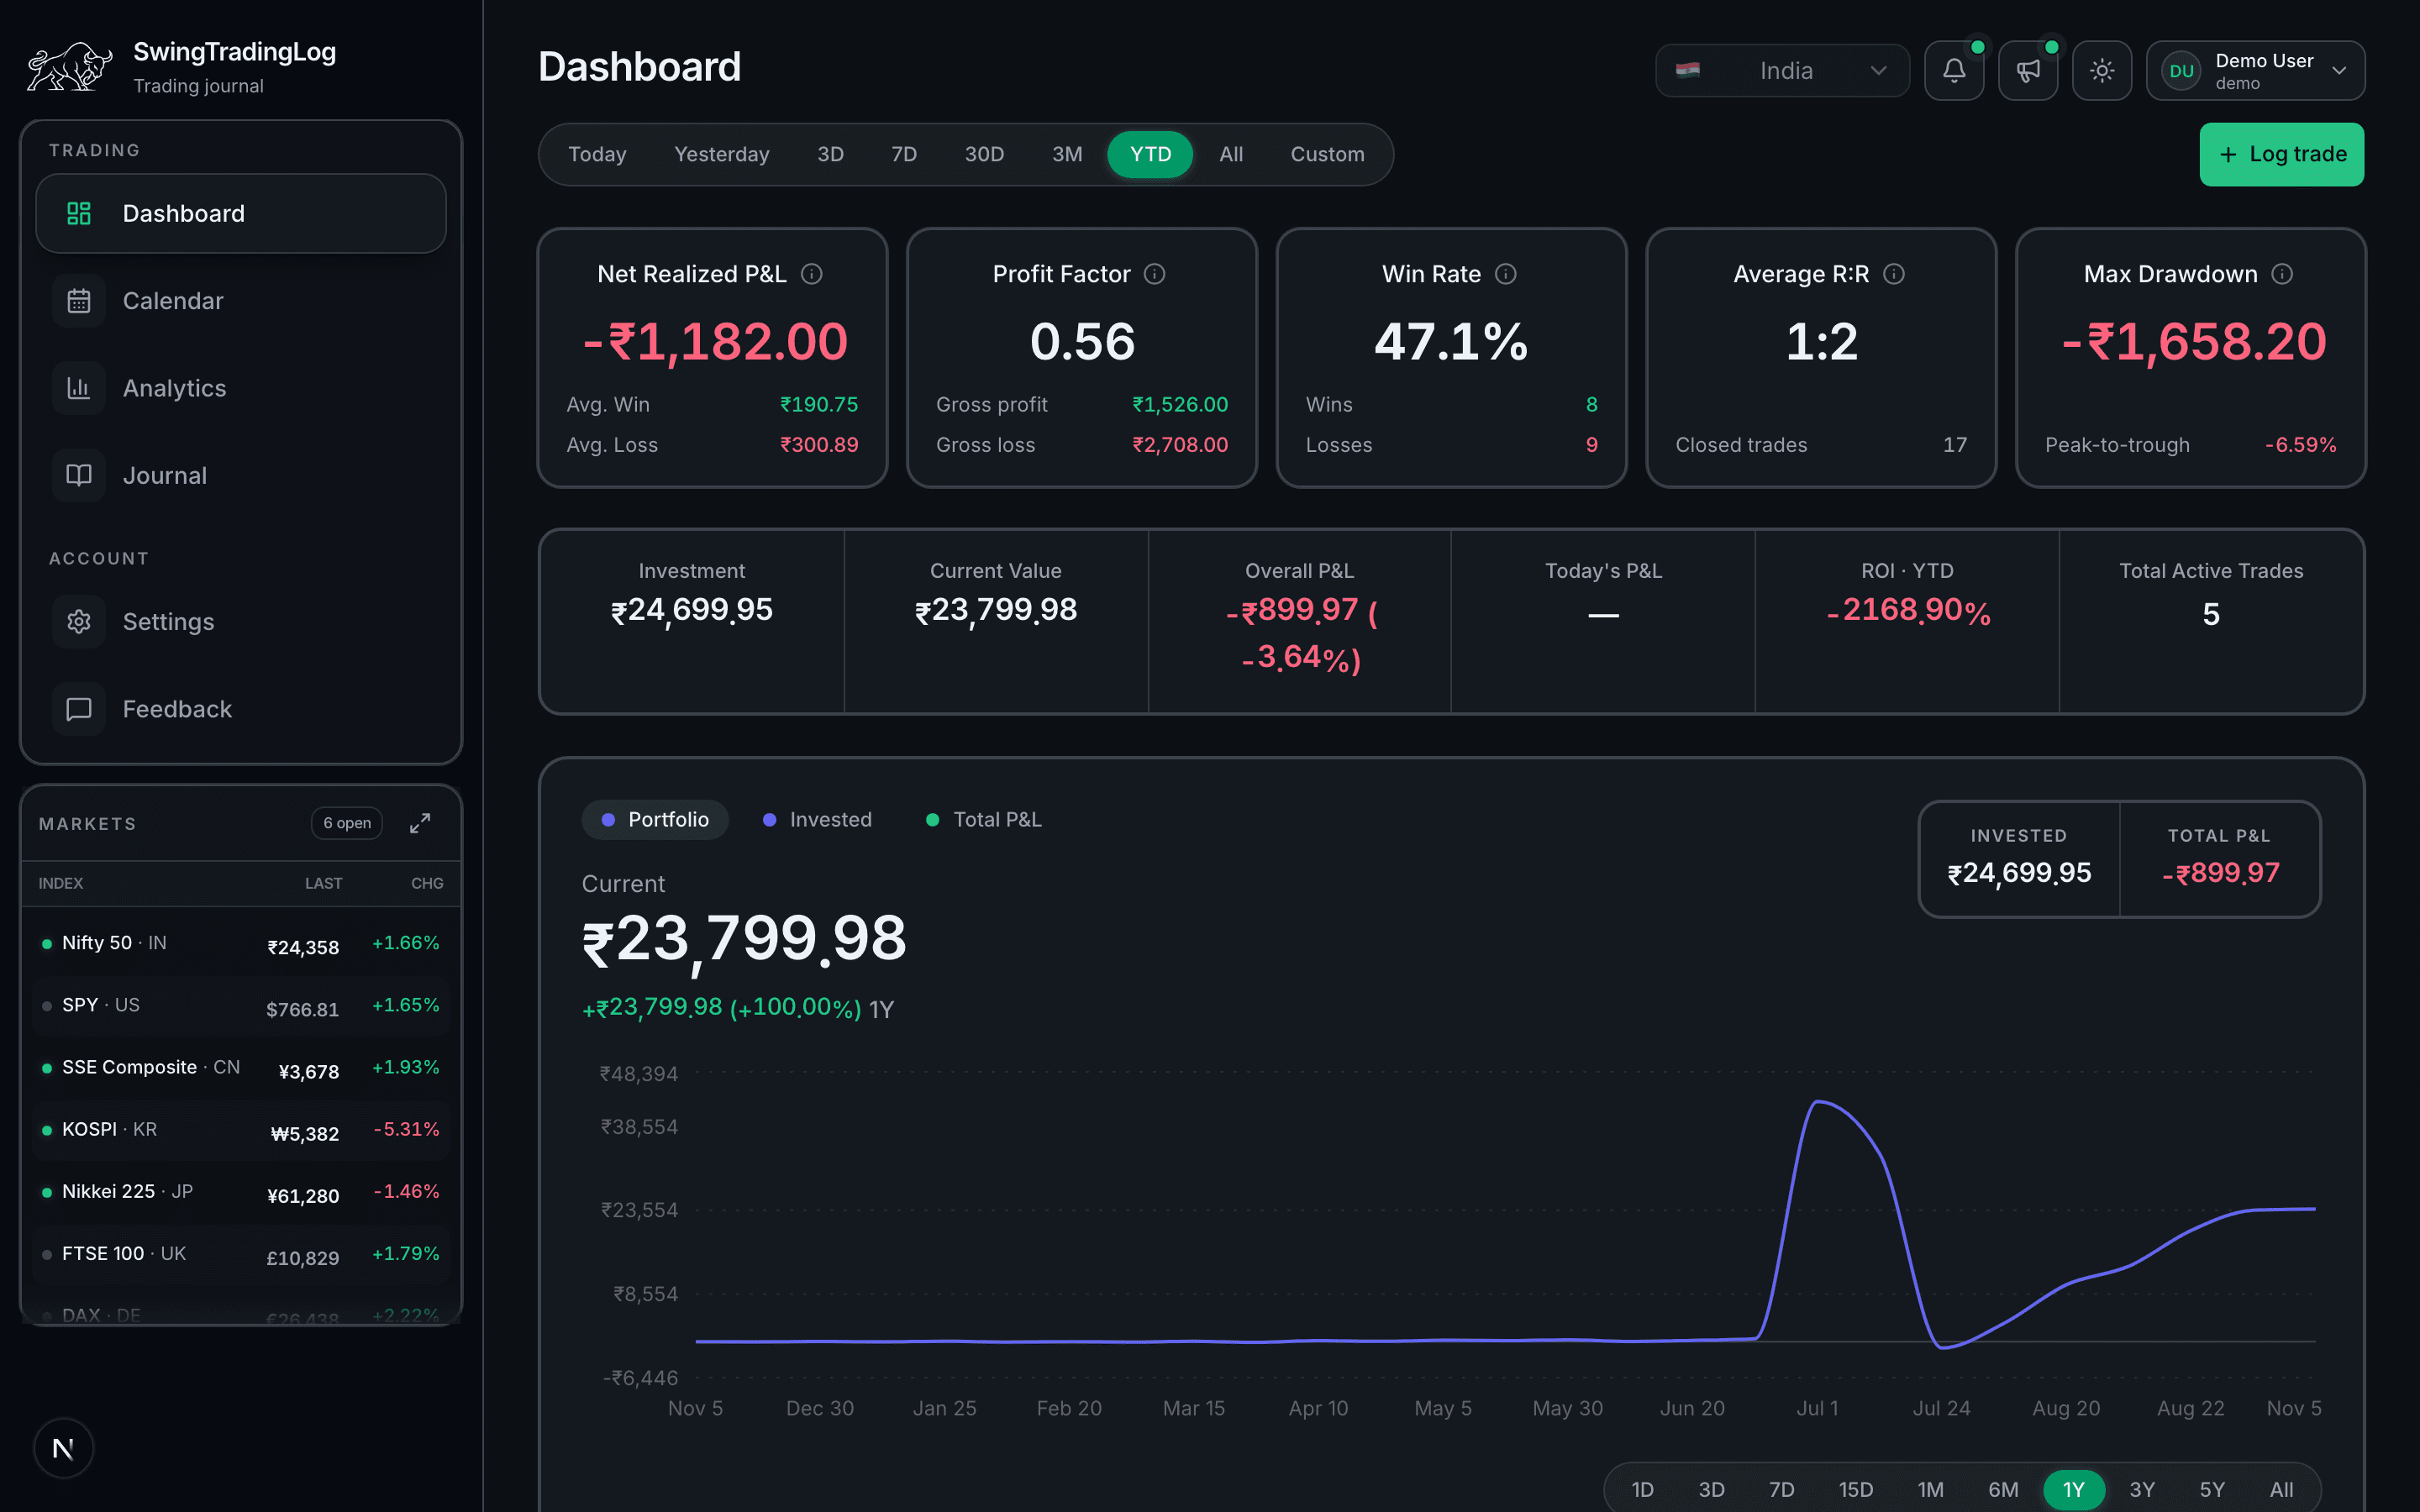
KPI ribbon
Net realized P&L, profit factor, win rate, average R:R, and max drawdown.
Period filters
Switch between today, 7D, 30D, 3M, YTD, or a custom range.
Investment summary
Invested, current value, overall P&L, and total active trades.
Equity curve
Portfolio value and total P&L plotted over your selected period.
Journal
A trade log built for review
Filter by period, search by ticker or tag, and manage active and closed positions with a performance ribbon on top.
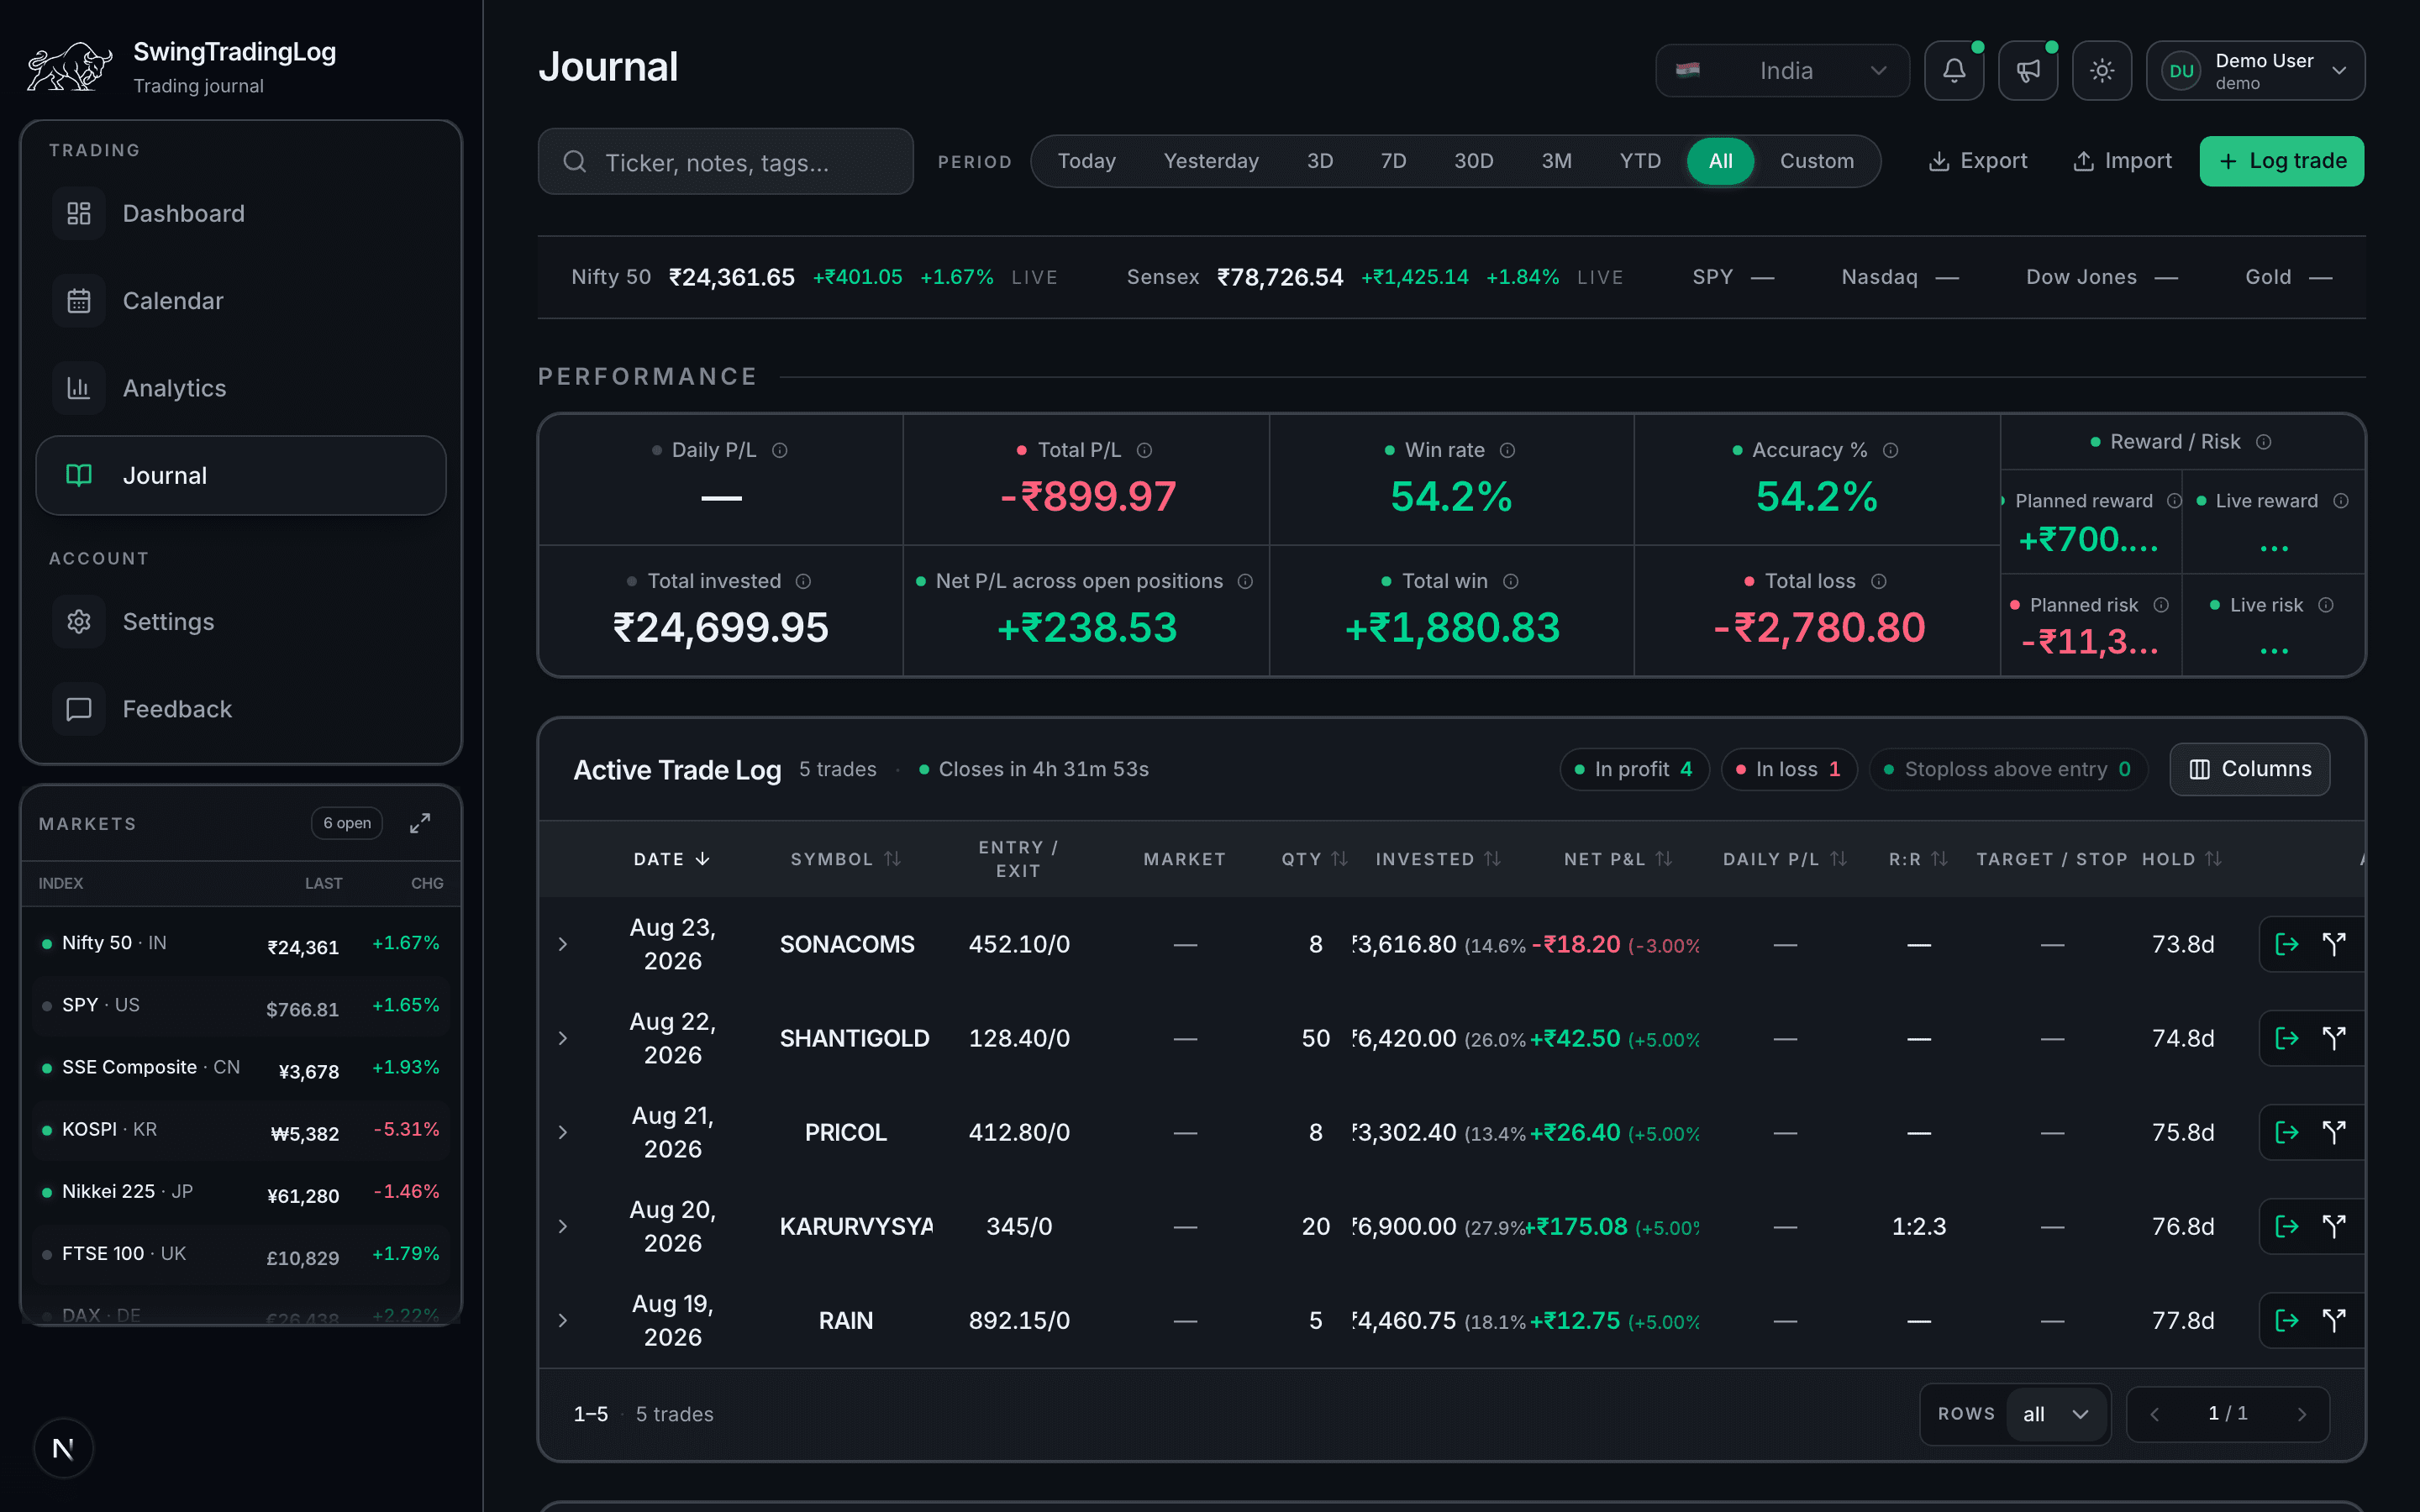
Search and filters
Find trades by ticker, note, tag, or time period.
Performance ribbon
Total P&L, win rate, accuracy, invested, and reward-to-risk.
Active trade log
Open positions with entry, invested, net P&L, R:R, and hold time.
Analytics
Attribution that shows what is working
Break realized P&L down by sector and market cap, read a P&L calendar, and track open-position risk without a spreadsheet.
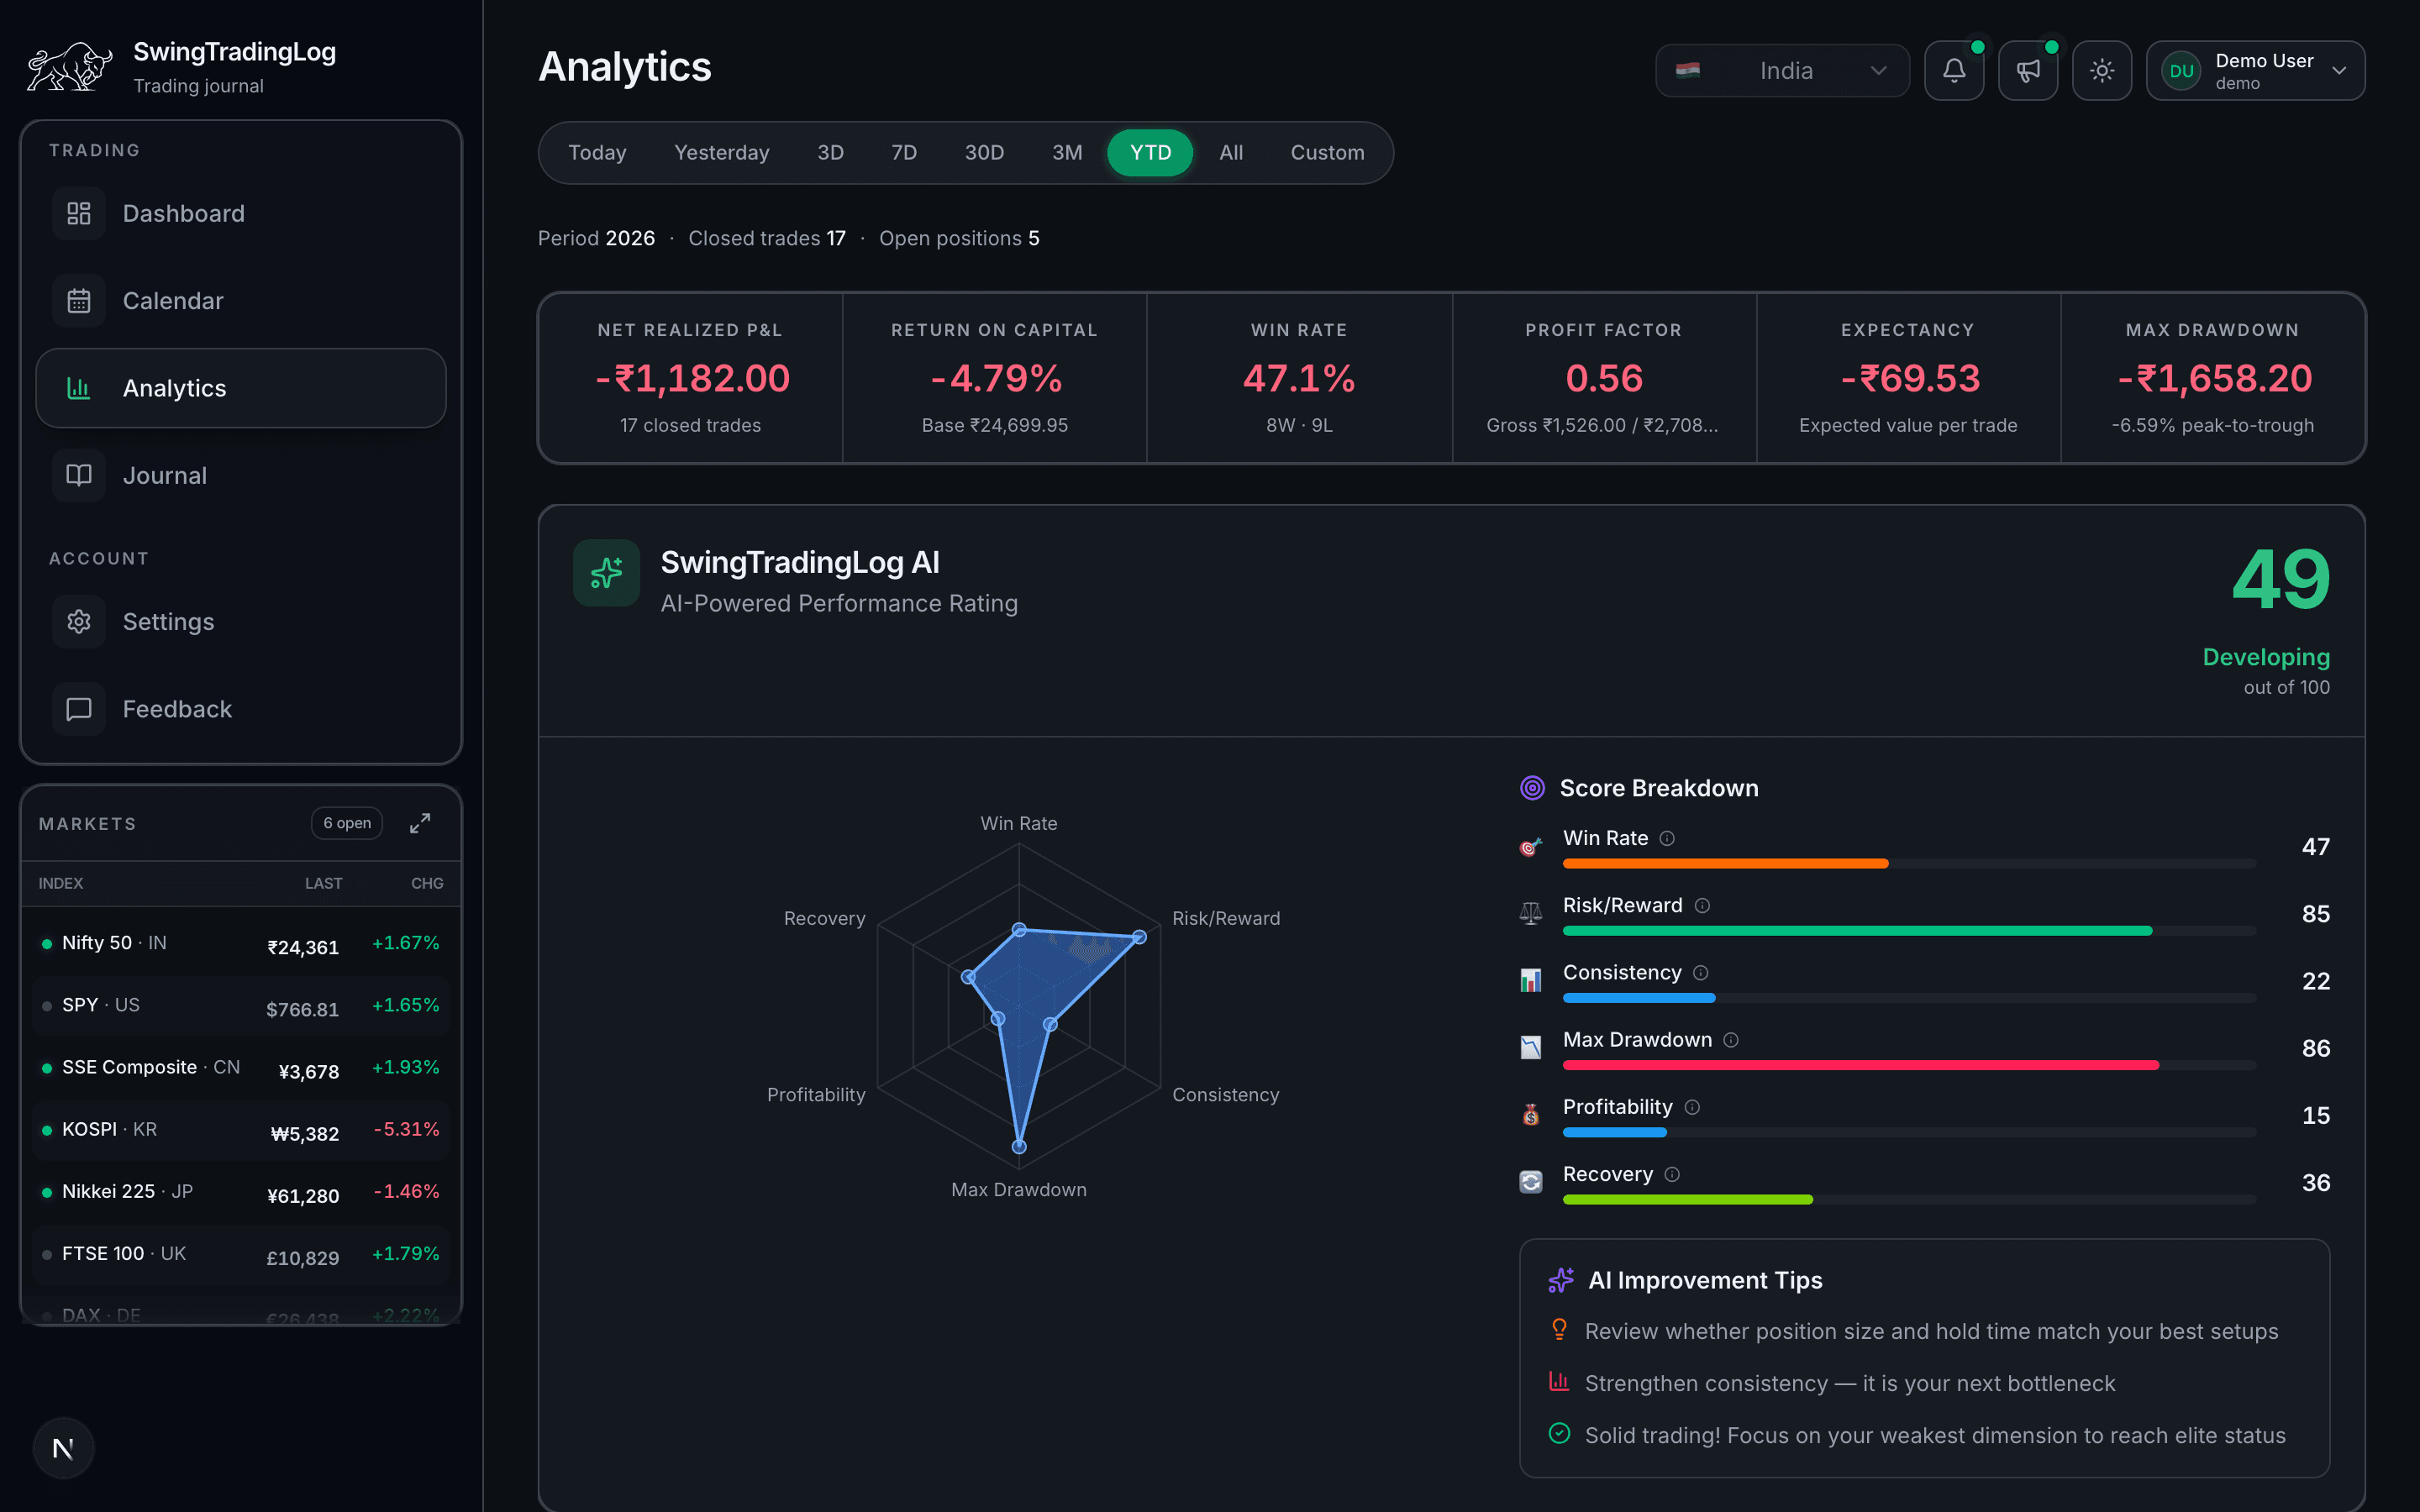
Risk ribbon
Return on capital, win rate, profit factor, expectancy, and drawdown.
Sector attribution
Realized P&L grouped by company sector.
Market-cap attribution
Results grouped by large, mid, small, and micro cap.
Calendar
Daily and monthly P&L at a glance
Spot green and red streaks across the month and drill into individual sessions.
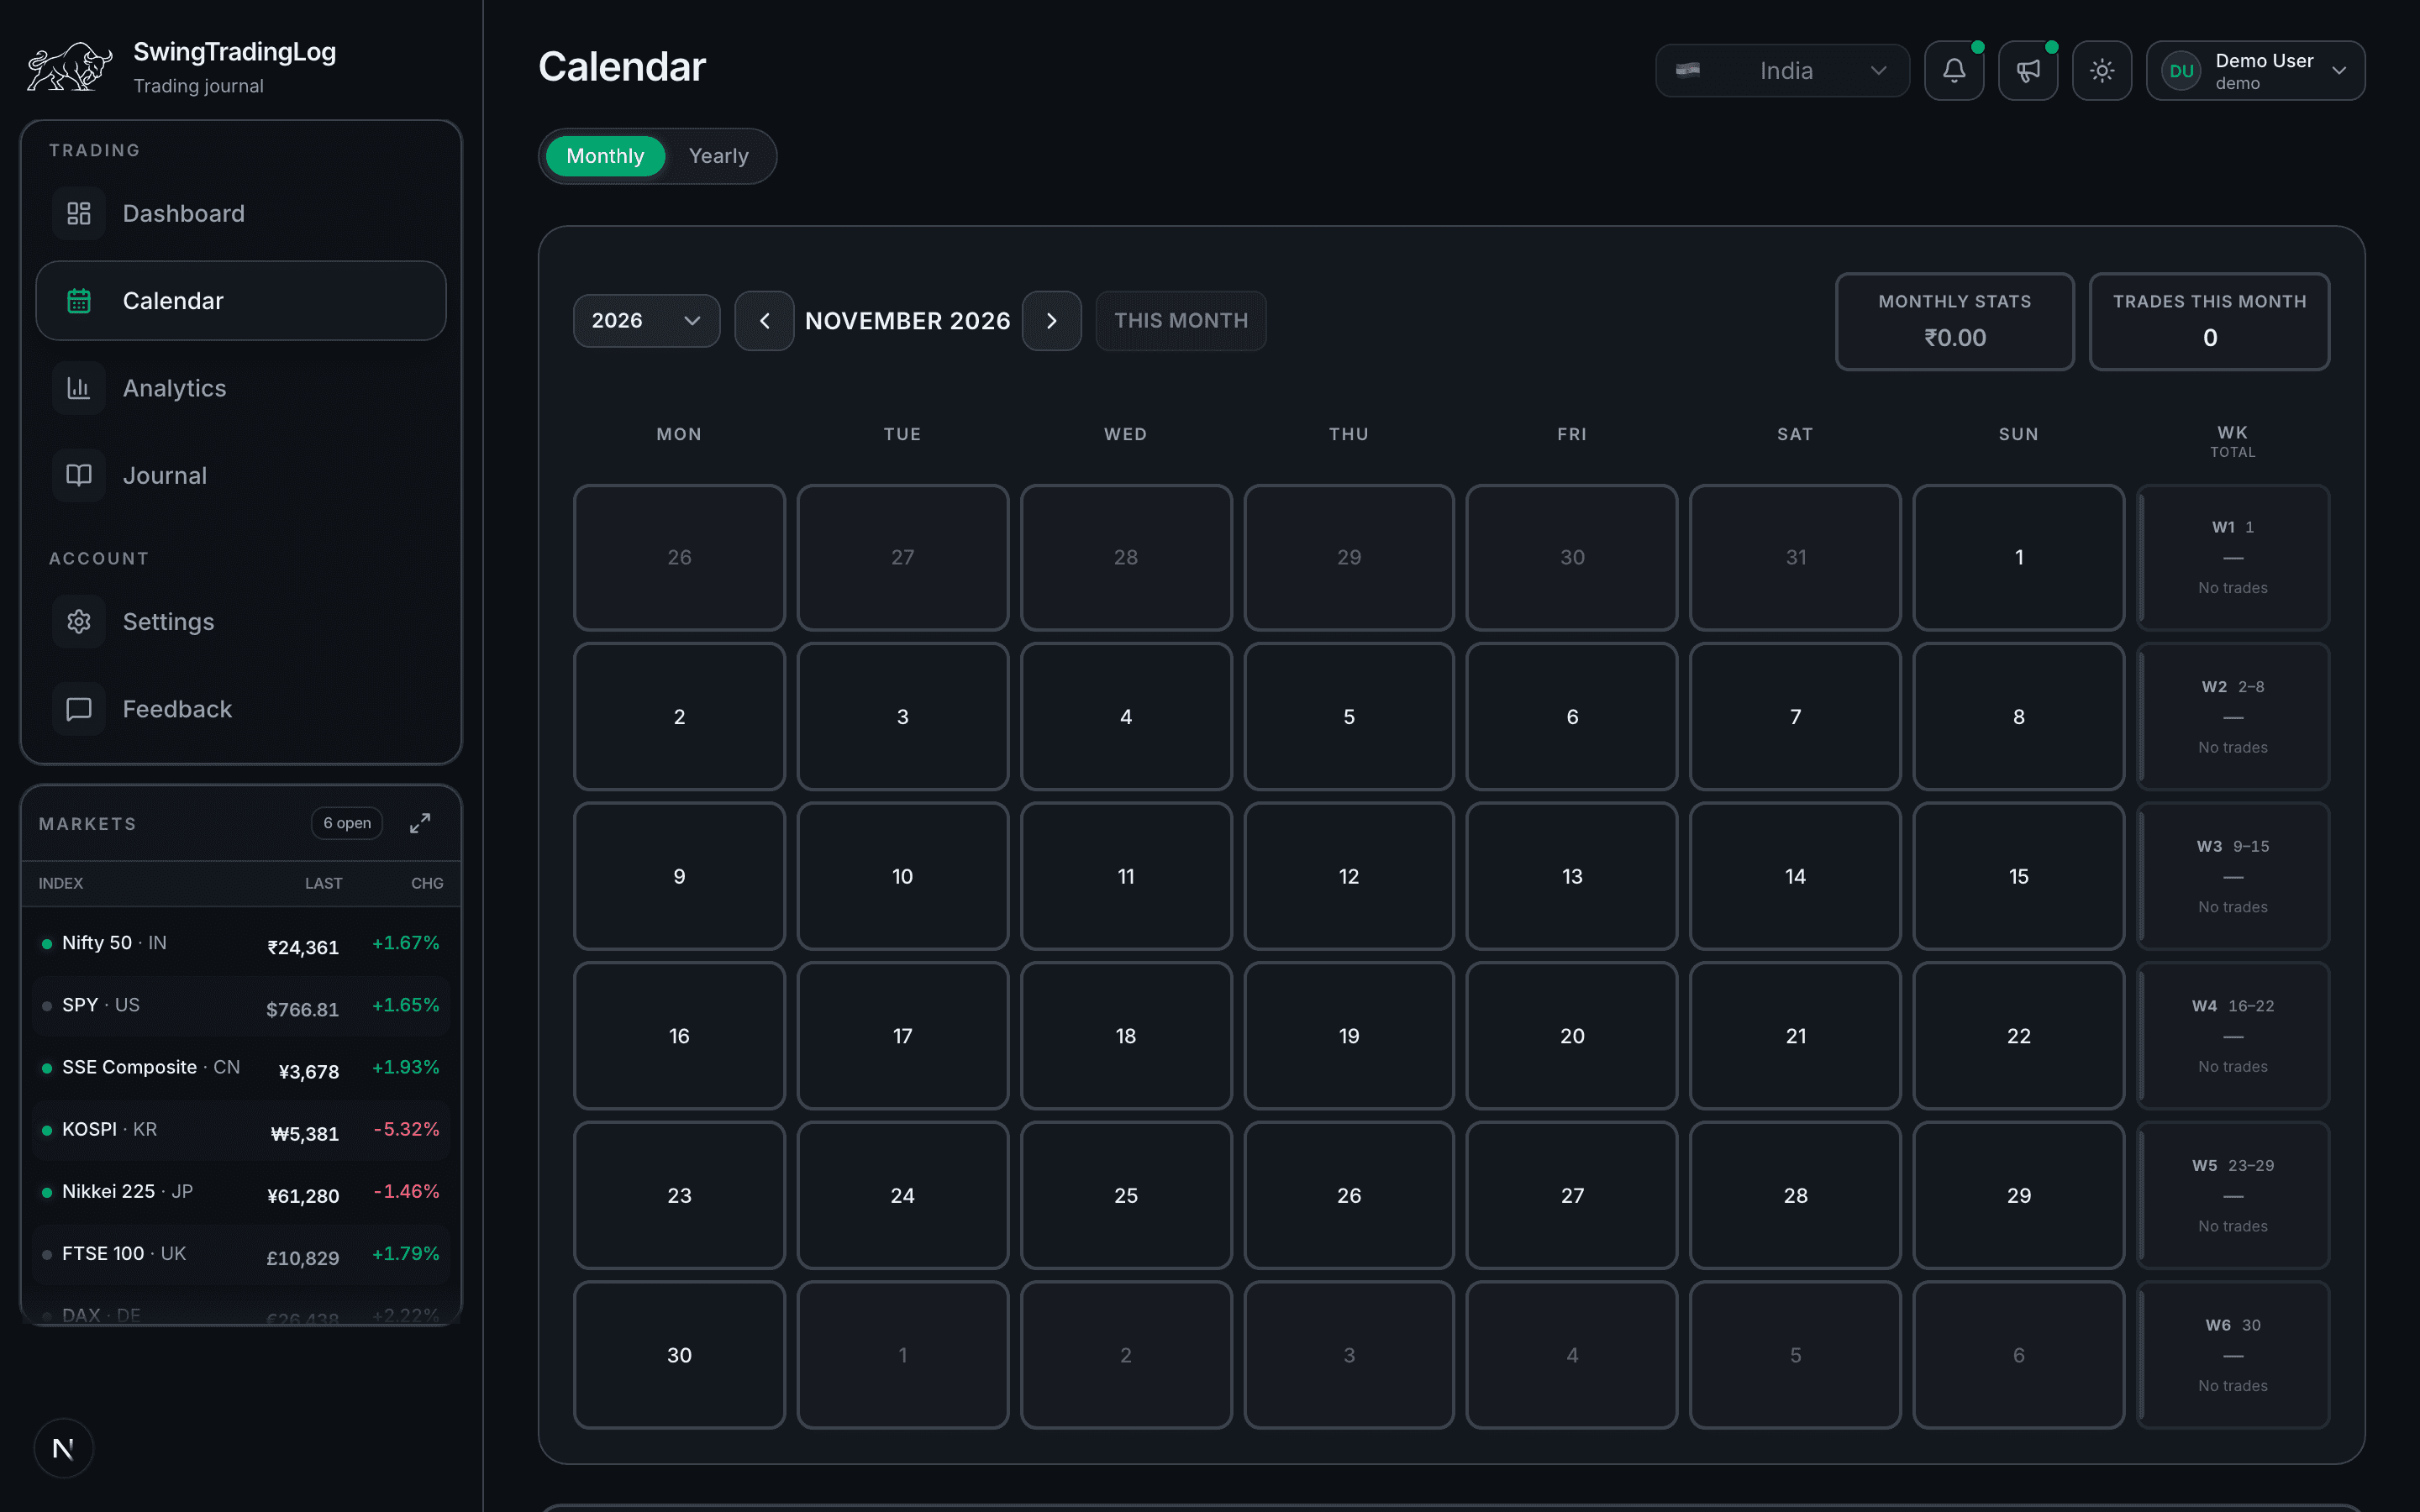
Daily cells
Each day shows realized P&L for closed trades.
Monthly summary
Totals and streaks roll up per month.