

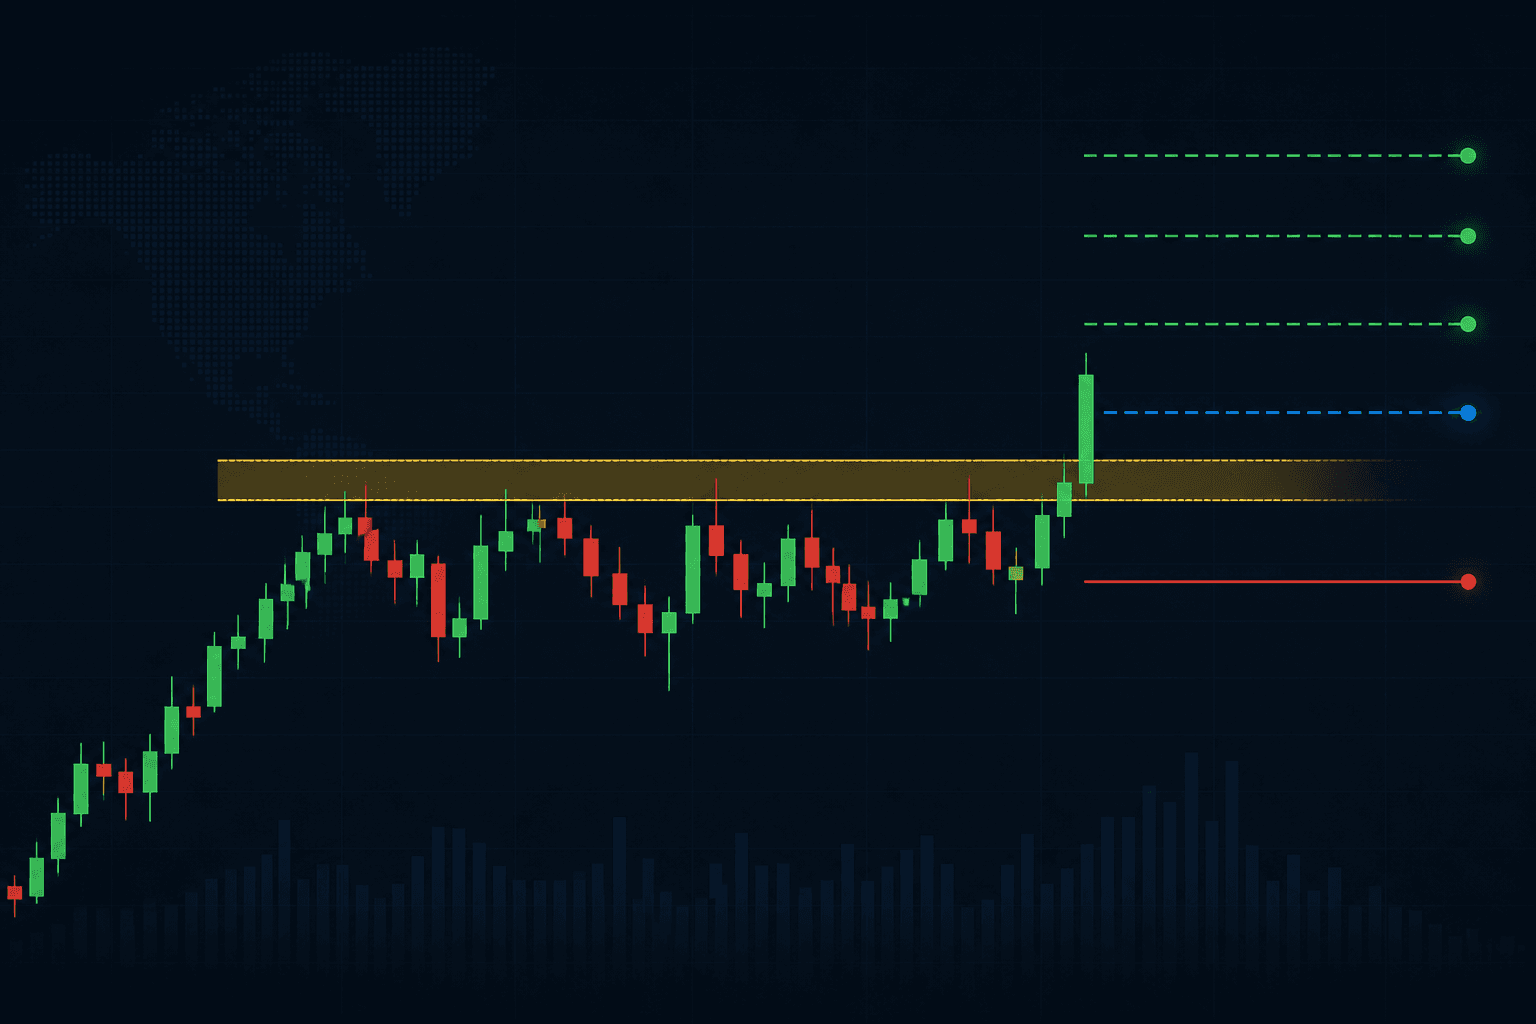
Illustration: SwingTradingLog
Weekly Timeframe Breakout Strategy: How to Enter and Exit Swing Trades Like a Pro
A rules-based weekly breakout strategy for swing traders: resistance zones, breakout confirmation, buy-stop entry, stop-loss placement, and 1:2 R:R scale-out at 1R and 2R.
Most breakout trades fail because the entry was a guess and the exit was a hope. Intraday spikes through resistance reverse by Friday; daily charts whipsaw on news. The weekly timeframe cuts that noise: one candle per week, one decision per setup, and enough room for a multi-week swing to develop.
This article teaches a repeatable weekly breakout system, not a vague “buy strength” idea. You will learn exactly where the resistance zone is, what makes a breakout candle valid, when to enter (and when not to), where the stop goes, and how to scale out at 1:1 and 1:2 without moving targets emotionally mid-trade.
The rules below are fixed on purpose. When you journal each setup with the same checklist, you can review whether the edge is the strategy or your execution, not whether you “felt” bullish on a random green candle.
What is a resistance zone?
A resistance zone is a horizontal band where price repeatedly stalled and sold off, prior highs, supply from older shareholders, or a level the market tested two or more times without closing above it. On a weekly chart, draw the zone from the cluster of rejection wicks and bodies, not a single tick-perfect line.
- Look for 2–3+ rejections at similar prices over several weeks or months
- Use a zone, not a hairline, markets rarely respect one exact penny
- Weekly close matters, a wick through the zone that fails by Friday is not a breakout
- Volume should expand on the eventual breakout week when possible (confirmation, not a hard filter)
Step 1: Identifying the breakout candle
A valid breakout candle is a weekly bar that closes above the resistance zone with conviction. It is not enough to poke above the level intraday and fade, the weekly close is your confirmation that buyers held control for the full week.
What makes a breakout candle valid
- Closes clearly above the zone, body finish above the band, not just an upper wick
- Closes near the weekly high, strong body (small upper wick relative to range)
- Decent range expansion, the bar is noticeably larger than recent inside weeks
- Volume above average (when available), participation supports the move
Step 2: The entry trigger
Do not enter on the breakout candle itself. Many breakouts fail the very next week. Your entry rule adds one bar of follow-through:
Entry rule
- Wait for the next weekly candle after the breakout candle
- Entry triggers when price trades above the high of the breakout candle
- Place a buy-stop order at the breakout candle high (your trigger level)
- If the next week never exceeds that high, there is no trade, pass and watch
Step 3: Setting the stop-loss
Place the stop-loss (SL) at the low of the candle immediately before the breakout candle, the last weekly bar still inside or just below the resistance zone. That candle represents the final point where sellers defended the level; if price falls back through its low, the breakout has likely failed.
- Why not the breakout candle low?, Too tight; normal pullbacks stop you out of valid trends
- Why not below the whole zone?, Often correct on lower timeframes, but this system uses the pre-breakout bar for a defined, chart-based 1R
- Use a weekly close below SL as your structural invalidation, intraday spikes may wick; respect your plan
Step 4: Trade management, 1:2 R:R with scale-out
Define R (one unit of risk) as entry price minus stop-loss price. All targets are multiples of R. This system uses a 1:2 reward-to-risk final target with a 50% scale-out at 1:1 and breakeven protection on the runner.
| Level | Formula | Action |
|---|---|---|
| Risk (R) | Entry − Stop-loss | Defines position size |
| Target 1 (1:1) | Entry + (1 × R) | Close 50%; move SL to entry (breakeven) |
| Target 2 (1:2) | Entry + (2 × R) | Close remaining 50%, trade complete |
| Stop hit (no T1) | Price reaches initial SL | Exit 100% for −1R loss |
Management sequence
- Enter full size at the buy-stop (breakout high)
- At Target 1 (1:1): sell half, move stop on the rest to breakeven (entry price)
- At Target 2 (1:2): sell the remaining half
- If price never reaches 1:1 and hits the original SL, exit the full position for a −1R loss
- Do not move SL to breakeven before 1:1, you need room for normal weekly volatility
Full worked example
Stock XYZ bases under a weekly resistance zone near $48. The pre-breakout candle (Week −1) has a low of $47.00. The breakout candle (Week 0) closes strong with a high of $52.00. Week +1 trades above $52, your buy-stop fills at $52.00. You buy 100 shares.
| Item | Price | Notes |
|---|---|---|
| Entry (buy-stop) | $52.00 | High of breakout candle |
| Stop-loss | $47.00 | Low of pre-breakout candle |
| R (risk per share) | $5.00 | $52.00 − $47.00 |
| Target 1 (1:1) | $57.00 | $52.00 + $5.00 |
| Target 2 (1:2) | $62.00 | $52.00 + $10.00 |
Scenario A, both targets hit: At $57 you sell 50 shares for +$5 × 50 = +$250, move SL to $52 on the rest. At $62 you sell 50 shares for +$10 × 50 = +$500. Total +$750 before fees.
Scenario B, stopped before 1:1: Price reverses to $47. Full 100 shares exit at SL: −$5 × 100 = −$500 (−1R on the planned risk). No breakeven move occurred because Target 1 never printed.
Log entry, SL, T1, T2, and whether you followed the scale-out rules in your journal. Compare planned R to realized R, see our Risk Reward Ratio Swing Trading Guide for more on tracking R-multiples.
Common mistakes
- Entering on the breakout candle, you chase closes that fail next week; wait for the buy-stop trigger
- Stop too tight, using the breakout low instead of the pre-breakout low gets shaken out on healthy retests
- Moving SL to breakeven too early, before 1:1, normal noise stops you out of winners
- Moving SL too late after 1:1, if you hit 1:1, the rule is half off and breakeven on the rest; greed turns +1R into a give-back
- Ignoring the weekly close, a daily spike through resistance is not this setup; work the weekly chart only
- Oversizing, one −1R loss should not damage the account; use Position Sizing For Swing Traders
Risk management and disclaimer
Size every trade so a full stop-loss costs only a small fraction of your account, commonly 0.5% to 1% of equity per position. With R = $5 per share and $250 max loss, you cap at 50 shares regardless of how confident you feel about the breakout.
Disclaimer: This article is for educational purposes only. It is not financial advice, a recommendation to buy or sell any security, or a guarantee of results. Past chart patterns do not predict future performance. Trading involves substantial risk of loss. Practice on paper or small size until you can execute the rules consistently, and consult a licensed professional for advice specific to your situation.
Conclusion: journal the system
A weekly breakout edge comes from doing the same thing on every setup: mark the zone, confirm the candle, trigger on the next bar, place the SL on the pre-breakout low, scale at 1R, finish at 2R. Without a journal, you will not know if you skipped entries, moved stops, or exited early on winners.
Log each trade in SwingTradingLog with the breakout tag, attach a weekly chart screenshot, and review monthly whether 1:2 setups actually pay after slippage. Start with our How To Start A Swing Trading Journal, use the risk calculator before every entry, and build your watchlist with How To Build Swing Trading Watchlist so you are ready when the next weekly close confirms.
Ready to log your swings? Start free on SwingTradingLog, or explore trading guides and the risk calculator.